Description

LIME
Brinch & Hogerheijde 2010, A&A, 523, A25. Dedicated website.
The engine of the ARTIST package is the new 3D adaptable grid line radiative transfer code, “LIME” developed by Christian Brinch. LIME solves the full non-LTE line excitation and radiative transfer problem on 3D random density-weighted Delaunay grids. The method ensures rapid convergence for problems of arbitrary geometries and complex species such as water.
Status: the LIME code is ready and a refereed paper about it was presented in A&A in 2010. It has been incorporated within the ARTIST package and is available for download there. The code is also available in a stand-alone version (1.2): anyone interested should get in touch with Christian Brinch.
DustPol
Padovani et al. 2012, A&A, 543, A16
With the Dust polarization component of ARTIST it is possible to calculate the dust continuum polarization signatures of, e.g., protostellar and circumstellar envelopes at submillimeter wavelengths. Given a user-defined model for the magnetic field vectors (either analytical or from a numerical simulation), the module and grain alignment efficiency, the module then calculates synthetic Stokes vectors that can be used for a 3D view of the polarization properties of the model.
Status: the dust polarization module has successfully been integrated into LIME. A paper describing the code has been published in A&A. It is now available for download.
Interface: Model library and GUI
Juhasz et al., Schaaf et al.
The interface consists of two main components. A set of Python scripts manages the interaction between a general model library and LIME. This can then be called by a graphical interface or directly in a Python shell. This GUI then calls LIME to simulate images. The user thus needs minimal background knowledge of the different codes - and “just” needs to decide on the physical input (or supply standard test modules). After running LIME, the user can then examine the output, e.g., in CASA (scripts for easy read-in of the LIME data are supplied). Also, documentation are supplied for how to examining the input and output in, e.g., Paraview. With this one can for example diagnose whether the supplied input structure is the one desired, how the excitation/optical depth of lines behaves parts of the model.


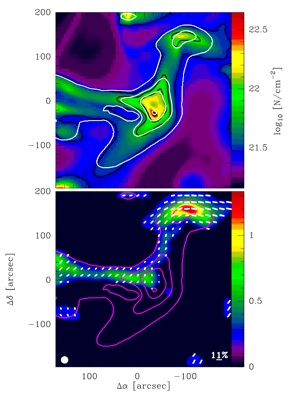
Snapshot of MHD simulation of collapsing protostellar core (from the StarFormat Astronet program; P. Hennnebelle et al. in prep.) processed with ARTIST dust polarization module. Shown are polarization vectors, dust polarized intensity (image) as well as continuum strength (white contours). M. Padovani et al., 2012
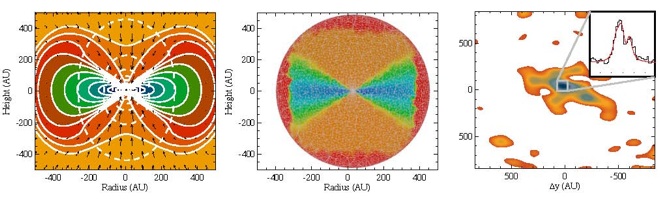
Line modeling using the LIME code illustrated. Left: simulation of disk formation in infalling protostellar core (velocity field shown with vectors, density profile in background image and temperature in dashed white contours. Center: LIME gridding of this model (point density shown with different colors). Right: Comparison between synthetic spectrum and model in center of such a protostellar system.
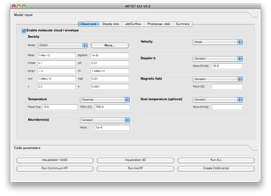
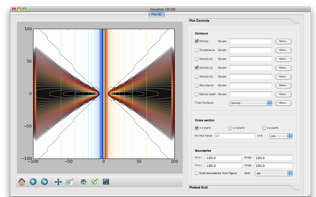
Screenshot from the ARTIST GUI: Left, the control window allowing the user to select a specified physical model. Right, the 2D visualization window where the model can be explored.
LinePol
Kuiper et al. in prep.
The line polarization part of ARTIST builds on the same principles of as the dust polarization components with additional complications due to the coupling between the line excitation and polarization properties.
Current status (July 2013): The first task in terms of the line polarization work has been to implement radiation from central sources in LIME, necessary to treat the radiation field, e.g., of high-mass stars or evolved stars properly. This part has now been completed. The line polarization module has been integrated within LIME and is currently undergoing the final tests and benchmarks. We expect this to be wrapped up in the coming few months.
People interested can contact Rolf Kuiper.

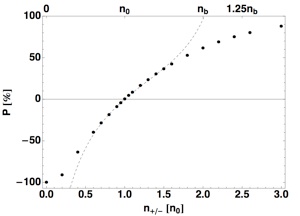
Fractional polarization P as function of the n± level population density (yielding σ radiation). The upper horizontal axis denotes the ratios to the n0 and nb level population densities. The dots mark the numerical results, which are in overall agreement with the analytic predictions (Kylafis (1983), eq. (23); dashed line).
Adaptable Radiative Transfer Innovations for Submillimeter Telescopes (ARTIST): 2009-2014